
Introduction
Tuning navigation in ROS2 Nav2 can quickly become a frustrating process.
For Ackermann-drive robots using planners like Hybrid A* or controllers like MPPI, even small parameter changes can lead to unexpected behavior.
A typical workflow looks like:
- Modify parameters in YAML
- Launch navigation
- Observe behavior in simulation
- Repeat
With dozens of parameters across planners, controllers, and costmaps, this process becomes slow, manual, and difficult to scale.
A natural question arises:
Can we automate Nav2 tuning?
At first glance, tools like Optuna, Bayesian optimization, or even agent-based workflows workflows seem promising. However, in practice:
Automation alone does not solve Nav2 tuning.
This article presents a different perspective:
Nav2 tuning is fundamentally a systems engineering problem, not just a parameter optimization problem.
The Problem with Nav2 Parameter Tuning
Nav2 exposes a large number of parameters across:
- Global planner (Hybrid A*, State Lattice)
- Controller (MPPI, DWB)
- Costmaps
- Robot model and kinematics
These parameters are tightly coupled. A change in one component often affects others.
The common “edit-run-observe” loop:
Edit YAML → Run → Observe → Repeat
has several limitations:
- No reproducibility across experiments
- No quantitative comparison between configurations
- Strong dependence on visual inspection
- Poor scalability across different scenarios
As highlighted in Nav2 community discussions (notably by maintainers), manual tuning becomes increasingly difficult as system complexity grows.
A Systems Perspective on Nav2
Instead of treating tuning as a search problem, it is more useful to view Nav2 as a multi-layer system:
- Robot model defines what is physically possible
- Costmaps define how the environment is interpreted
- Planner defines feasible paths
- Controller defines how those paths are executed
Poor navigation behavior is often a result of incorrect assumptions in one of these layers, not just “bad parameters”.
Parameter Classification for Nav2
A practical way to simplify tuning is to categorize parameters into three types.
1. Constant Parameters (Robot Geometry)
These represent the physical properties of the robot:
- Footprint
- Wheelbase
- Minimum turning radius
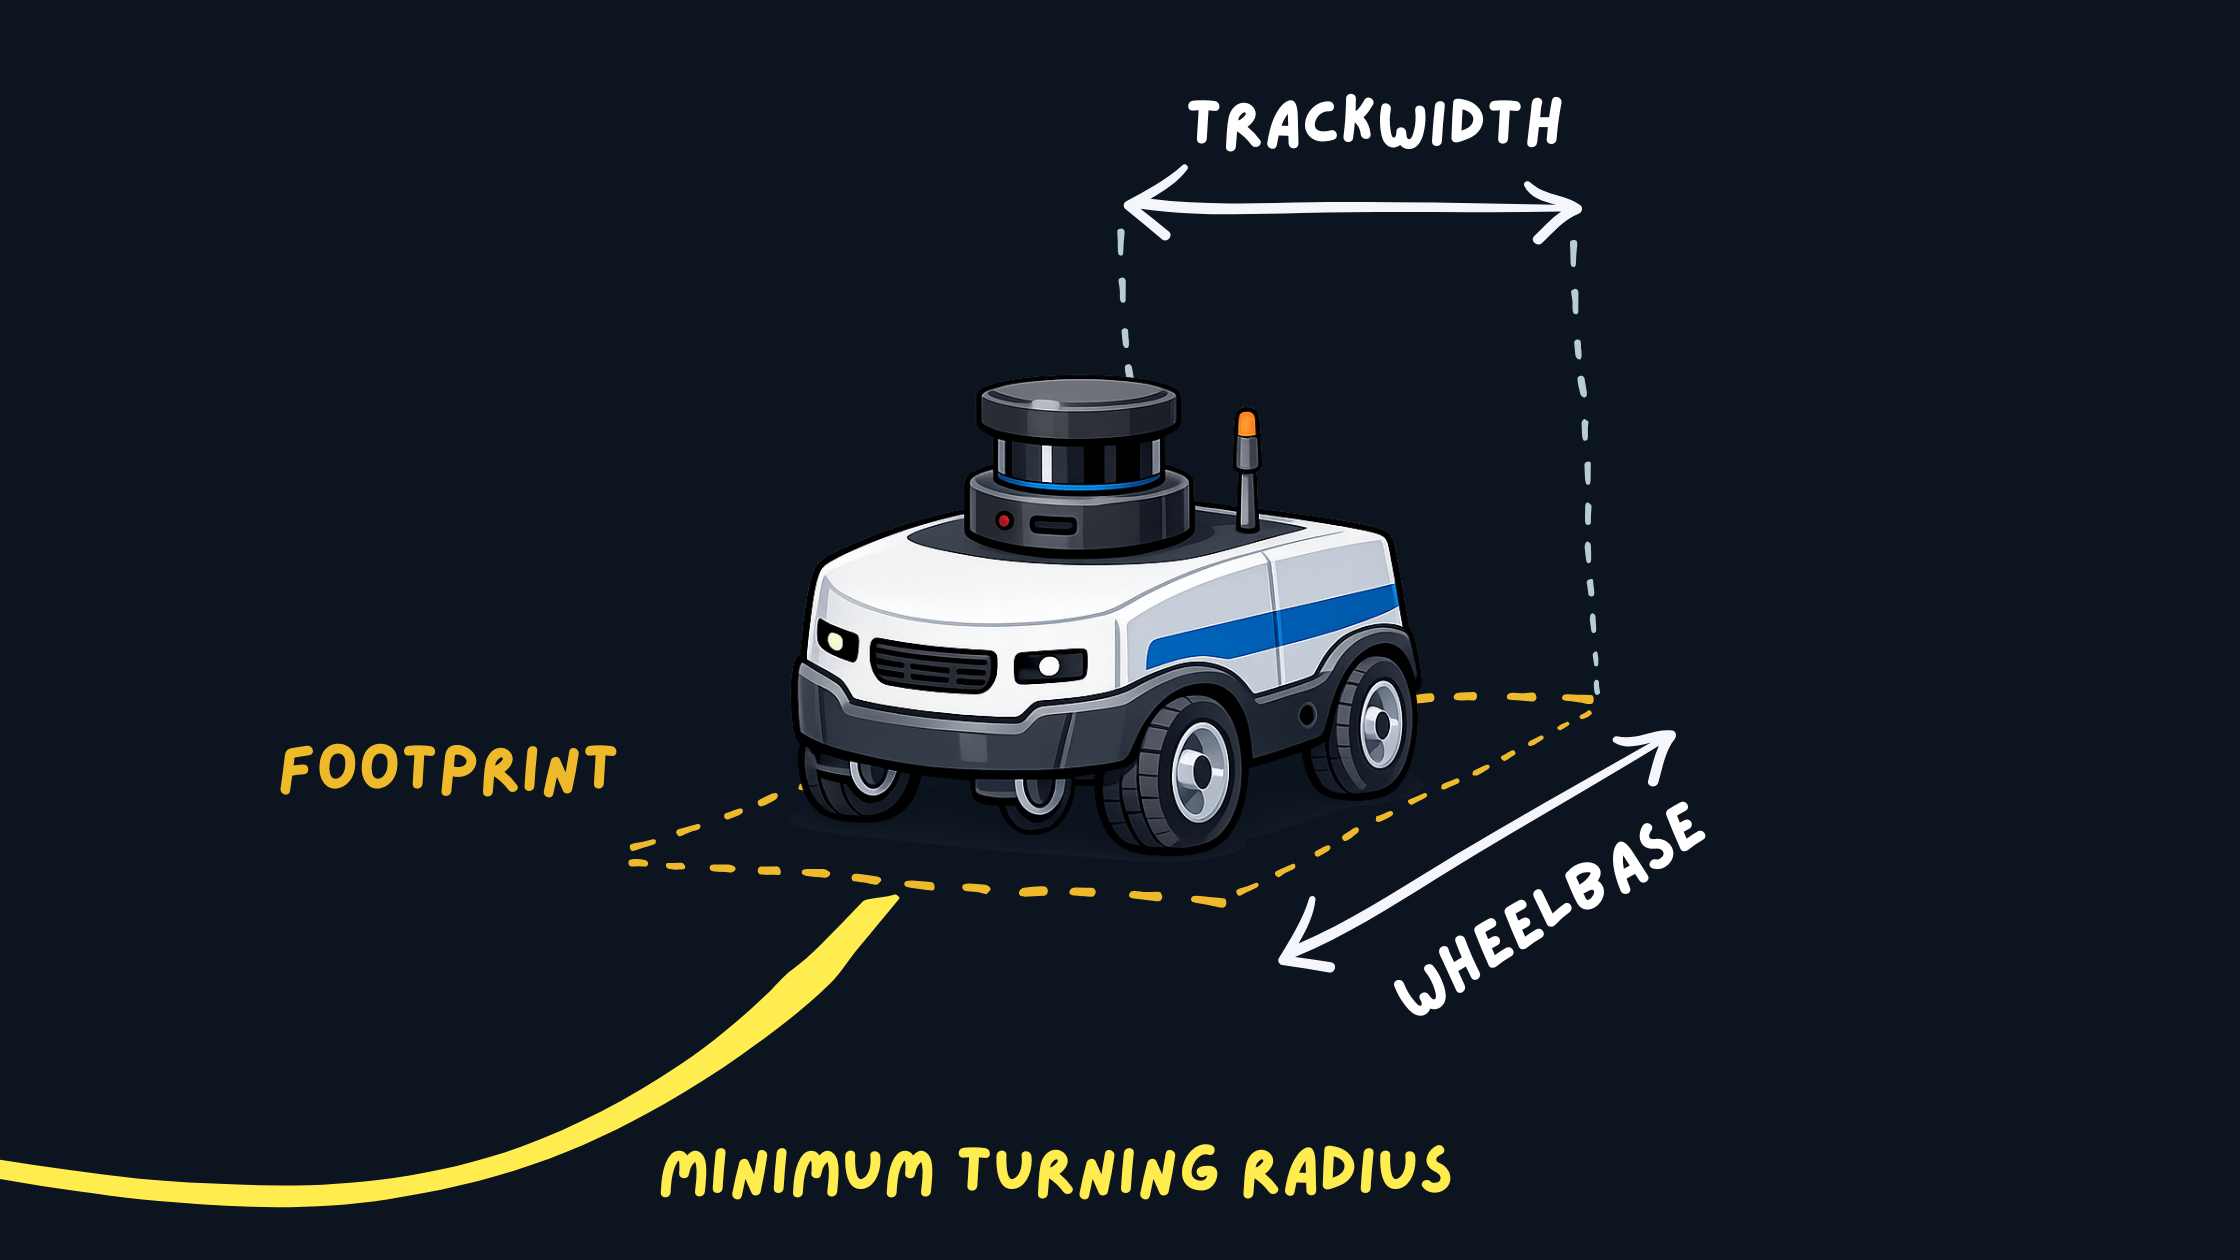 Robot Footprint and Geometry
These should match real-world measurements and should not be tuned for behavior.
Incorrect values can lead to:
- Invalid or infeasible paths
- Collisions despite correct planning
- Controller instability
2. Hard Parameters (Environment Representation)
These define how the robot perceives obstacles:
- Inflation radius
- Cost scaling factors
- Obstacle layers
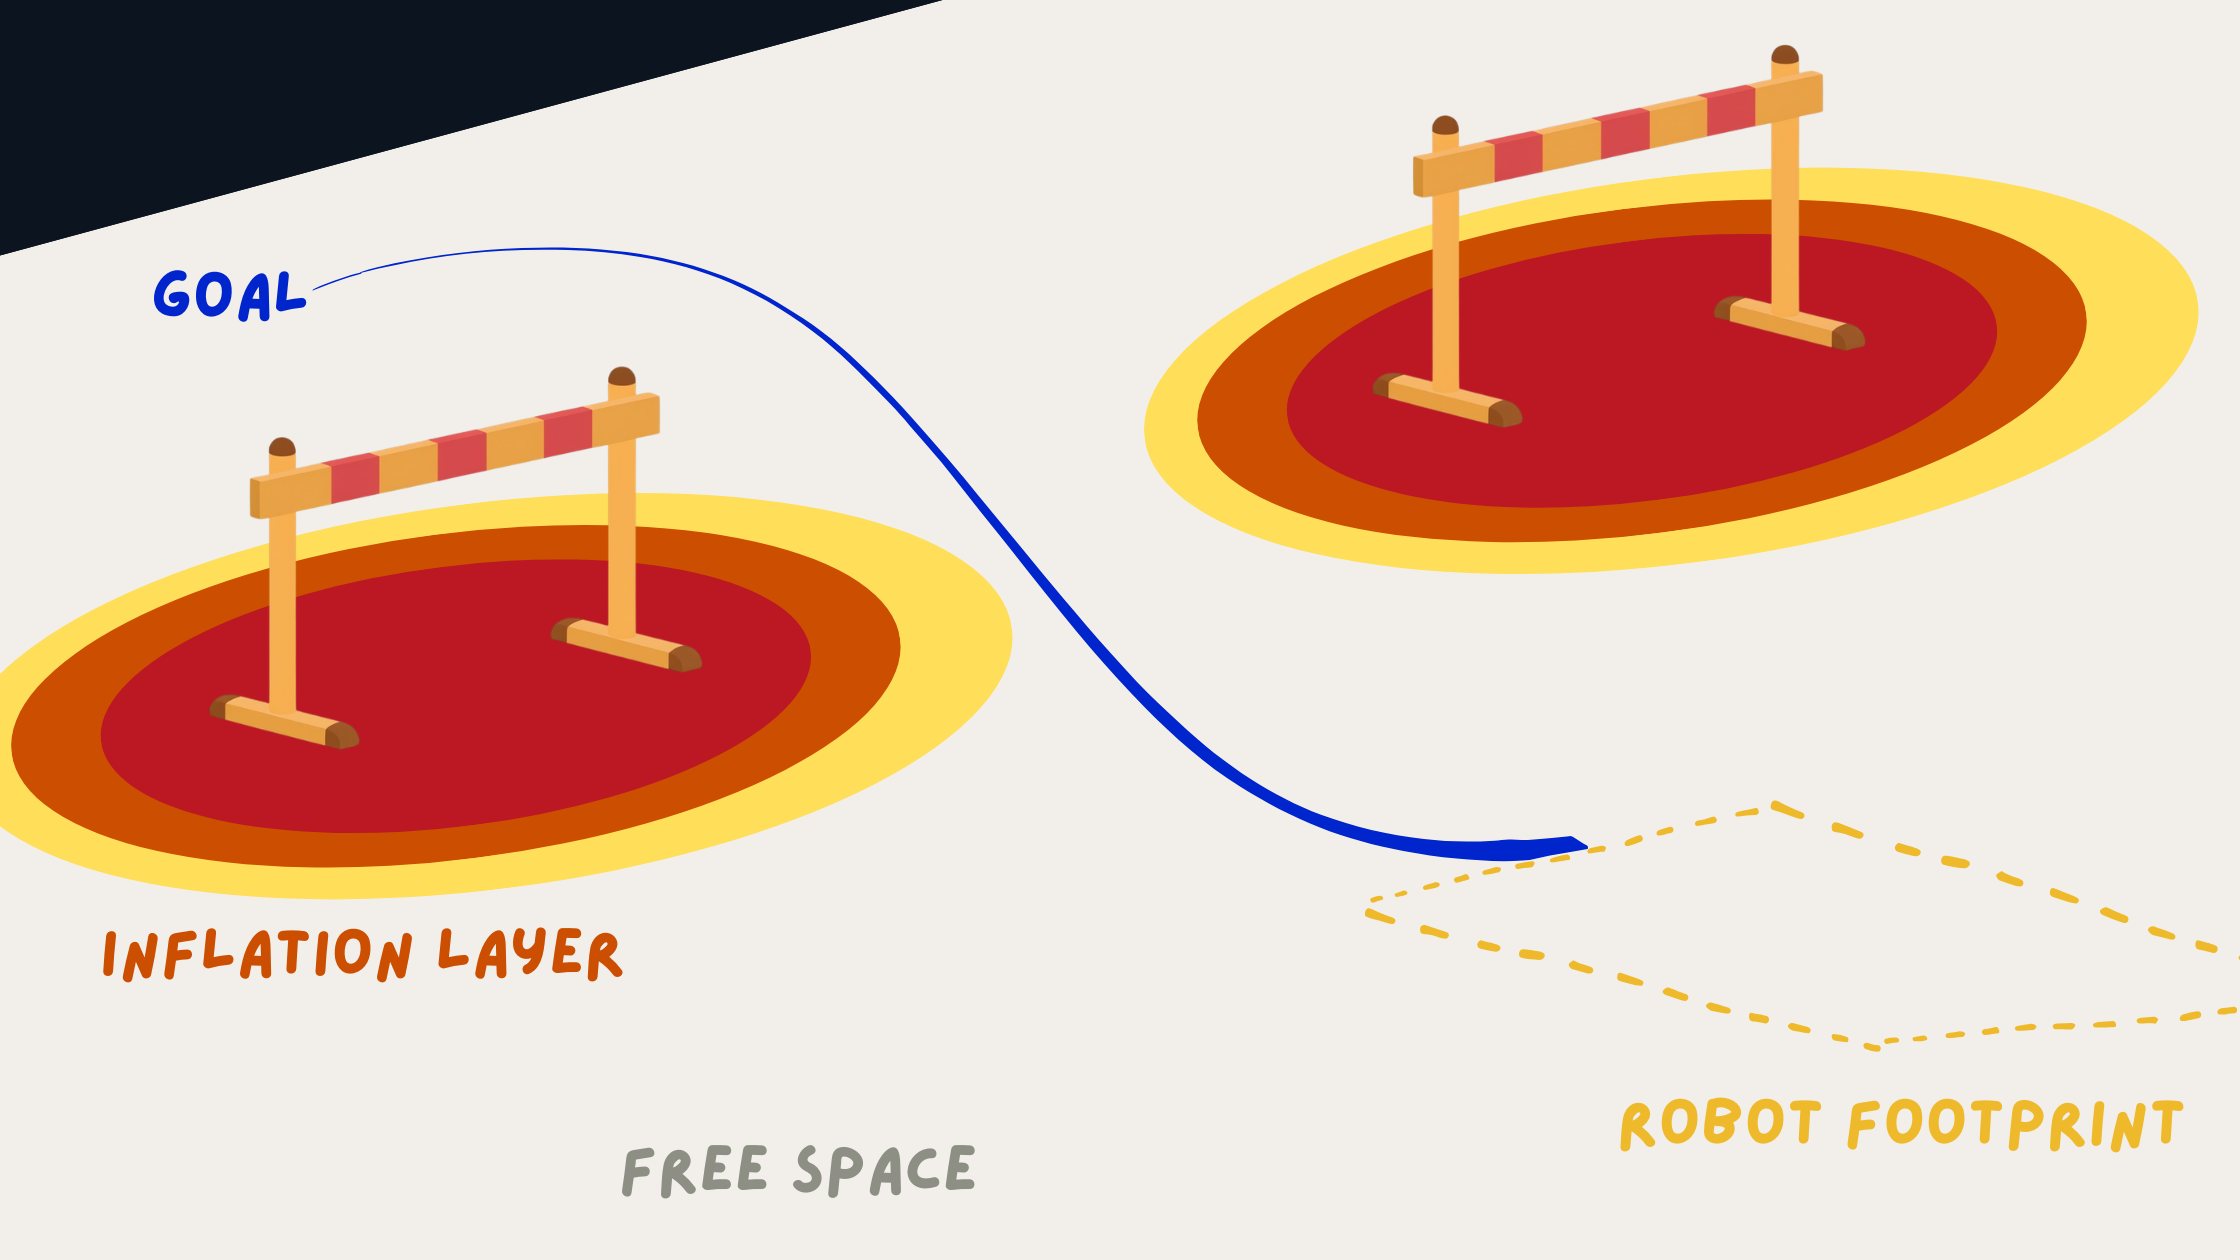 Costmap and Inflation Visualization
They directly influence:
- Clearance from obstacles
- Safety margins
- Path feasibility
These parameters are typically tuned once per environment and remain relatively stable.
3. Soft Parameters (Behavioral Tuning)
These control navigation behavior:
- MPPI critic weights, DWB parameter weights
- Velocity and acceleration preferences
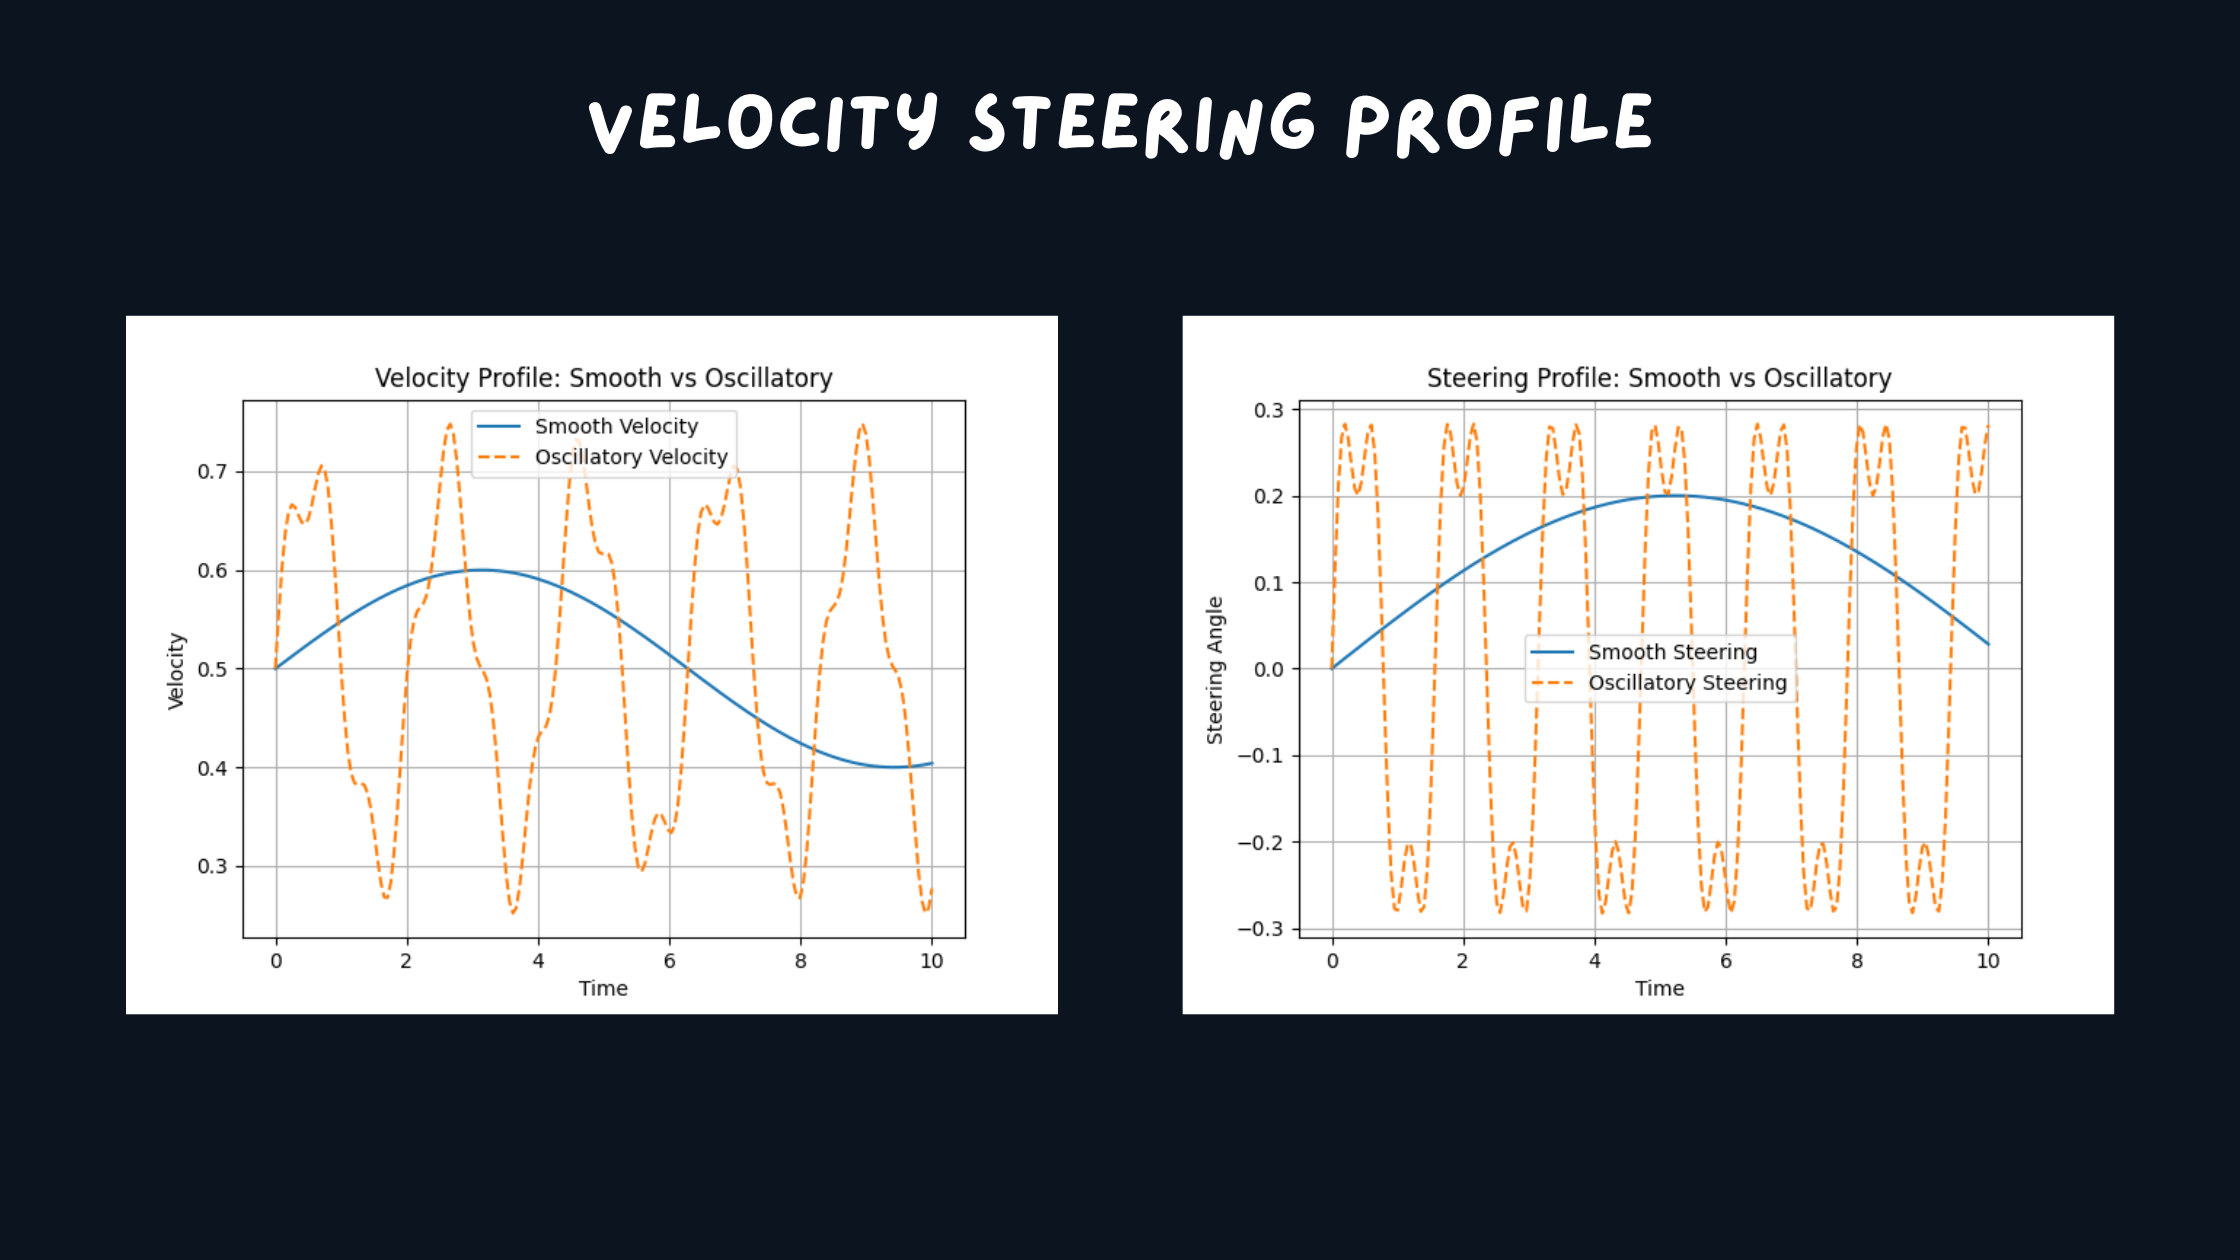 Trajectory Smoothness Comparison
They affect:
- Smoothness of motion
- Aggressiveness
- Oscillations and steering stability
These are the primary parameters adjusted during iterative tuning.
This separation helps isolate problems and prevents conflicting tuning decisions across different parts of the system.
The Missing Piece: Benchmarks
One of the biggest gaps in Nav2 workflows is the lack of standardized benchmarks.
Instead of testing random navigation goals, define consistent scenarios:
benchmarks:
  - full_loop
  - tight_corridor_uturn
  - corner_escape
  - reverse_reposition
Each scenario evaluates a specific capability:
- Tight space maneuvering
- Reverse behavior
- Long-distance navigation
- Stability in constrained environments
Start Simple: Progressive Benchmarking
A common mistake when tuning Nav2 is jumping directly into complex scenarios like tight corridors or full loops.
This makes debugging difficult since multiple components (planner, controller, costmaps) are stressed at once.
Instead, use progressive benchmarks, start simple, and then increase complexity.
Level 1: Primitive Behaviors
benchmarks:
  - straight_line
  - in_place_rotation
  - gentle_turn
These test basic control:
- Straight motion stability
- Smooth rotation
- Steering oscillations
 Straight Line Benchmark Visualization
Issues here usually point to:
- Controller critics and parameters
- Velocity limits
Level 2: Constrained Behaviors
benchmarks:
  - narrow_passage
  - obstacle_avoidance
These test interaction with the environment:
- Obstacle clearance
- Costmap behavior
Problems here are often related to:
- Inflation radius
- Cost scaling
Level 3: Full Scenarios
benchmarks:
  - full_loop
  - tight_corridor_uturn
  - corner_escape
These combine planning and control under realistic conditions.
 Full Environment Loop Benchmark Visualization
Why This Works
- Level 1 → Controller issues
- Level 2 → Costmap issues
- Level 3 → System-level issues
This layered approach reduces trial-and-error and makes tuning more systematic by isolating issues at the correct level of the system.
Example Benchmark Results
 Tight Corridor UTurn Benchmark Visualization
 Corner Escape Benchmark Visualization
Using Foxglove recordings allows clear visualization of trajectories, velocity profiles, and controller behavior.
Once benchmarks are defined, the next step is to make experiments reproducible.
YAML-Driven Experimentation
Instead of modifying a single configuration repeatedly, define experiments explicitly:
experiment:
  name: "high_clearance_smooth"

nav2:
  inflation_radius: 0.7
  mppi:
    temperature: 0.3
    critic_weights:
      path_follow: 5.0
A simple runner script can execute:
run_experiment exp.yaml
This enables:
- Reproducible experiments
- Easy comparison between configurations
- Structured iteration
Quantitative Evaluation Metrics
Relying only on visual inspection is insufficient.
Useful metrics for evaluating Nav2 performance include:
- Time to goal
- Path length
- Minimum obstacle distance
- Velocity or steering smoothness
- Number of oscillations
Example Comparison
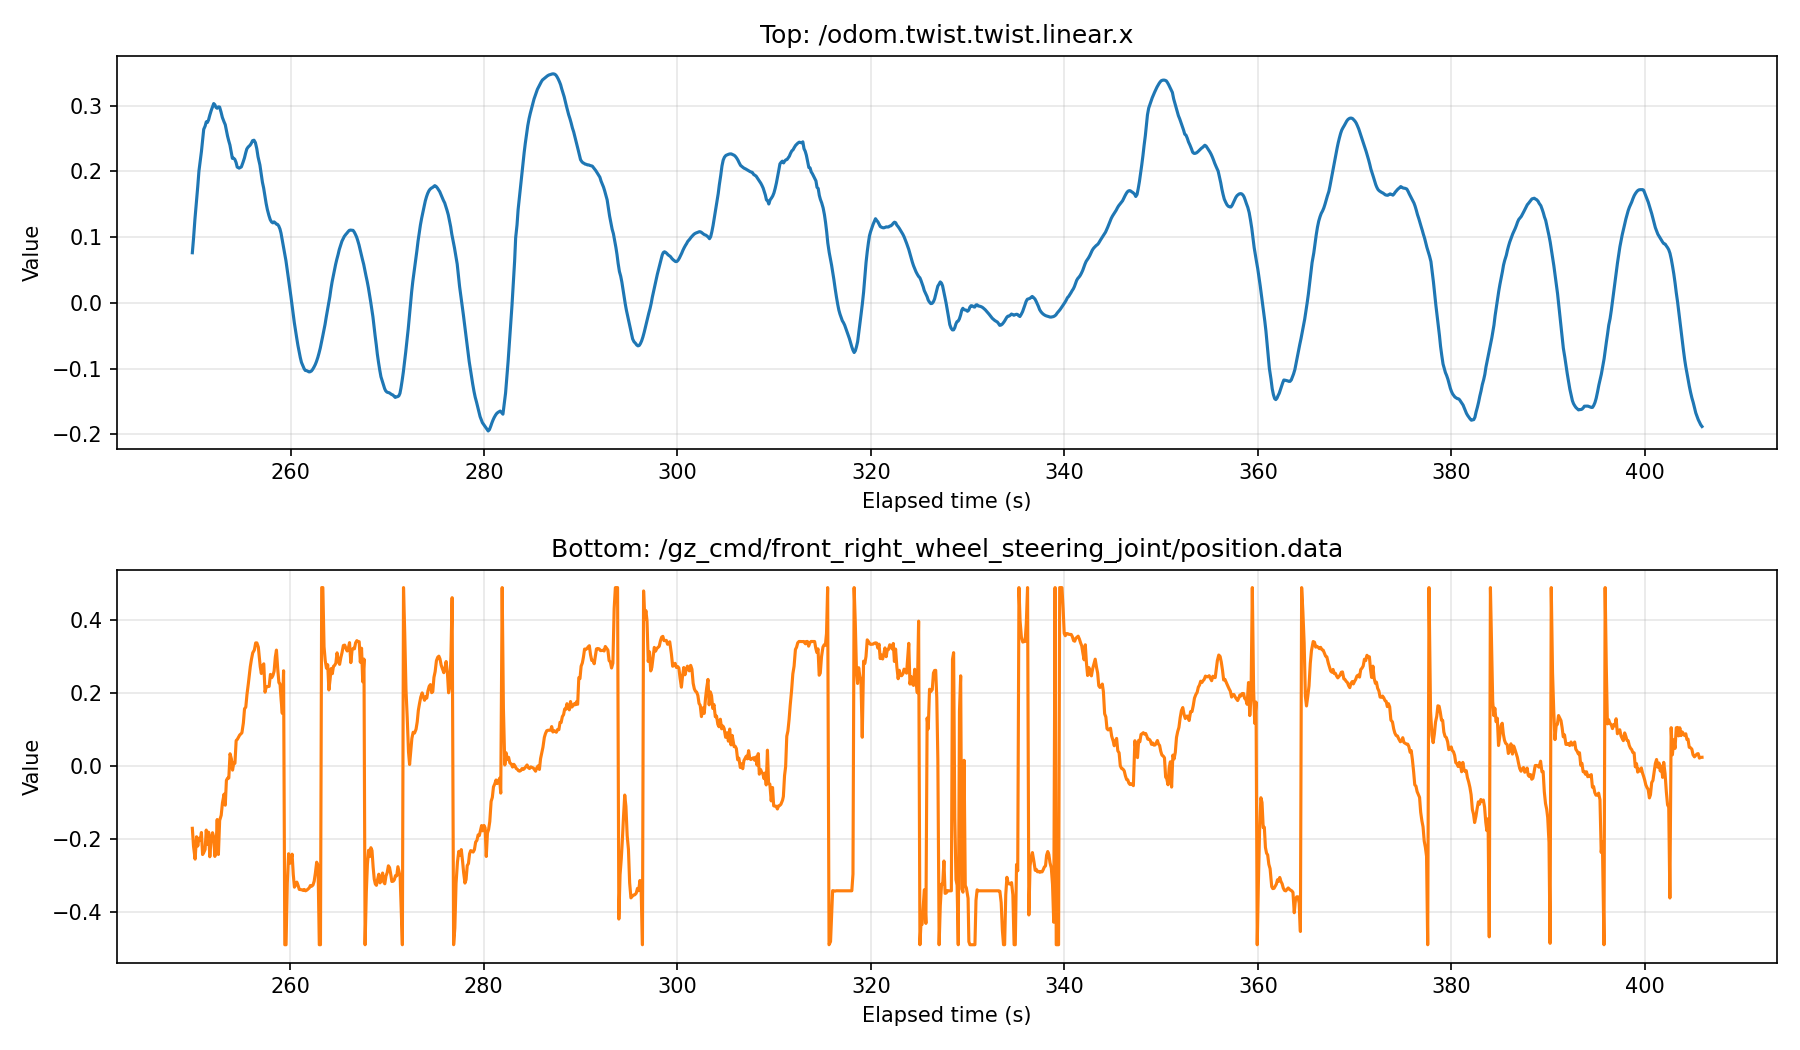 Logged Steering and Velocity Signals
Even simple logging of these metrics significantly improves decision-making during tuning.
Key Observations
From applying this structured approach:
1. Many issues originate from incorrect modeling
Incorrect footprint or costmap configuration often leads to poor navigation performance.
2. Benchmark-driven tuning is more reliable
Fixed scenarios make it possible to compare configurations objectively.
3. Parameter grouping simplifies tuning
Separating constant, hard, and soft parameters reduces complexity.
4. Automation is not the first step
Automated tuning tools are useful only after:
- Benchmarks are defined
- Metrics are established
- System behavior is understood
Toward a Better Nav2 Workflow
A structured navigation tuning workflow can be organized as:
nav2_benchmark/
├── scenarios/
├── configs/
├── runner/
├── metrics/
└── results/
Such a framework enables:
- Reproducible experiments
- Quantitative evaluation
- Scalable tuning workflows
Conclusion
Nav2 tuning is often framed as a parameter optimization problem.
In practice, it is a systems engineering problem involving:
- Accurate robot modeling
- Consistent environment representation
- Structured benchmarks
- Quantitative evaluation
Automation can help, but it is not the solution.
A structured approach based on experiments, metrics, and system-level understanding leads to more reliable and scalable navigation performance.
Discussion
- How do you currently tune Nav2?
- Do you rely on visual inspection or quantitative metrics?
- Would a standardized benchmarking framework improve your workflow?